Note
Go to the end to download the full example code.
Getting clustering metadata
This example will go over how to extract metadata which a clustering algorithm may have generated.
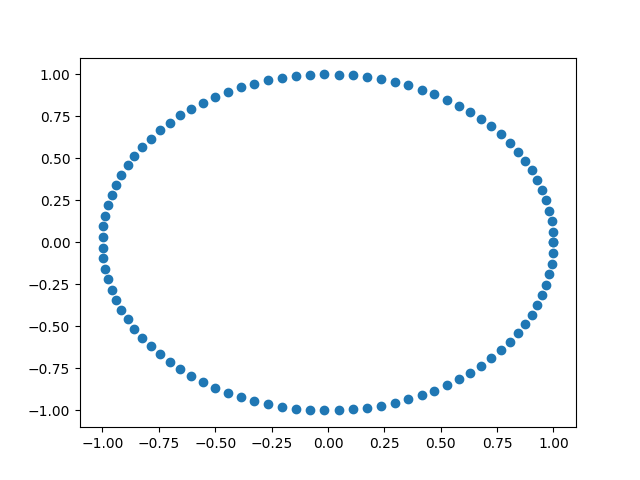
Projecting our data
projection = data[:, 0]
plt.scatter(data[:, 0], data[:, 1], label="data")
plt.scatter(projection, np.zeros_like(projection), label="projection")
plt.show()
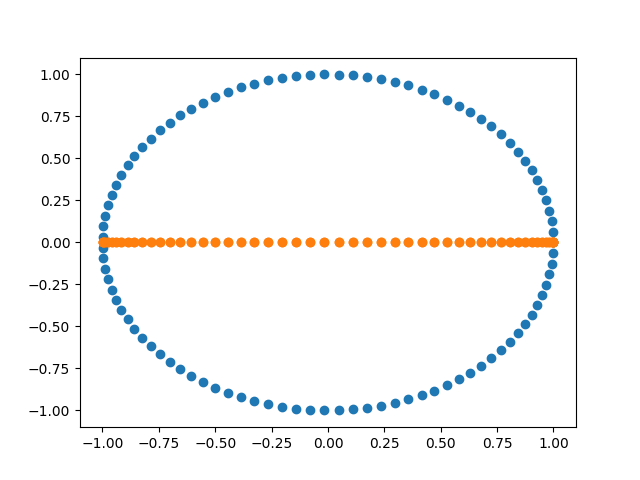
Covering our data
import zen_mapper as zm

cover, _ = zm.width_balanced_cover(
    n_elements=3,
    percent_overlap=0.4,
    data=projection,
)
Defining a clusterer
from sklearn.cluster import AffinityPropagation

sk = AffinityPropagation()
clusterer = zm.sk_learn(sk)
Computing the mapper graph
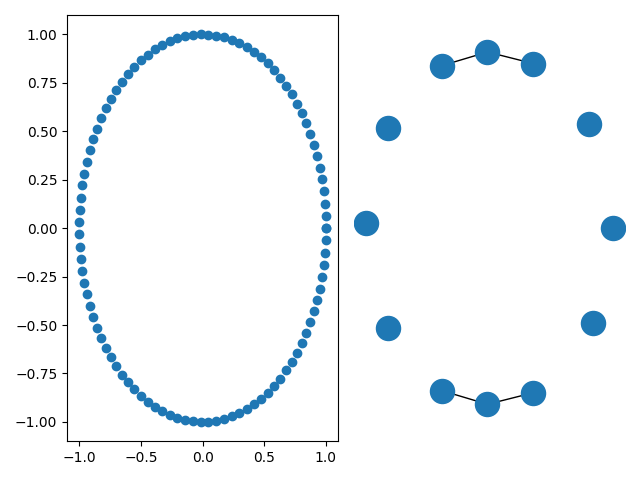
Plotting using cluster_metadata
import networkx as nx

from zen_mapper.adapters import to_networkx

fig, (ax1, ax2) = plt.subplots(1, 2)
ax1.scatter(data[:, 0], data[:, 1], label="data")
pos = dict()
for cover_element, cluster_meta in zip(result.cover, result.cluster_metadata):
    for node, center in zip(cover_element, cluster_meta.cluster_centers_):
        pos[node] = center


G = to_networkx(result.nerve)
nx.draw(G, pos=pos, ax=ax2)
plt.tight_layout()
plt.show()
Total running time of the script: (0 minutes 0.203 seconds)