Note
Go to the end to download the full example code.
Using a distance matrix
Generating data
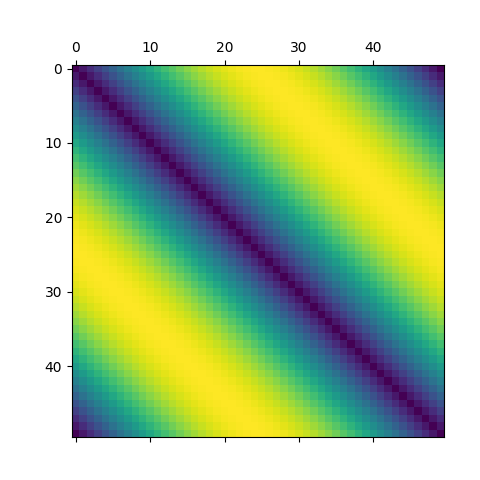
For this example we will generate evenly distributed points on a circle then compute the distance matrix of those points. In practice it makes little sense to go through this song and dance unless your data is given as a distance matrix.
Projecting our data
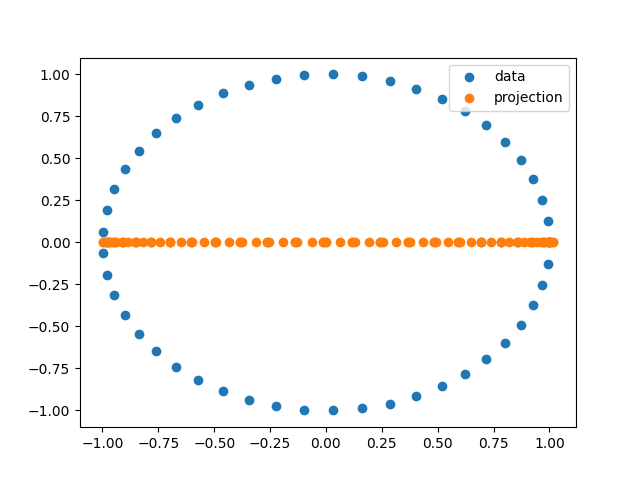
From here we will pretend that we don’t know the underlying data which generated the distance matrix. We pick [MDS](https://scikit-learn.org/stable/modules/generated/sklearn.manifold.MDS.html) as our lense function as it plays nicely with distance matrices.
from sklearn.manifold import MDS

projection: np.ndarray = MDS(
    n_components=1,
    metric="precomputed",
    n_init=1,  # type: ignore
    init="classical_mds",
).fit_transform(data)

plt.scatter(circle[:, 0], circle[:, 1], label="data")
plt.scatter(projection, np.zeros_like(projection), label="projection")
plt.legend()
plt.show()
Defining a clusterer
This is the last place where we need to do something different to facilitate running mapper on a distance matrix. All we have to do is tell the base clusterer that the metric is precomputed. From there the adapter should be clever enough to detect this fact.
from sklearn.cluster import AgglomerativeClustering

import zen_mapper as zm

sk = AgglomerativeClustering(
    linkage="single",
    n_clusters=None,  # type: ignore
    distance_threshold=0.2,
    metric="precomputed",
)
clusterer = zm.sk_learn(sk)
Computing the mapper graph
cover_scheme = zm.Width_Balanced_Cover(n_elements=3, percent_overlap=0.4)

result = zm.mapper(
    data=data,
    projection=projection,
    cover_scheme=cover_scheme,
    clusterer=clusterer,
    dim=1,
)
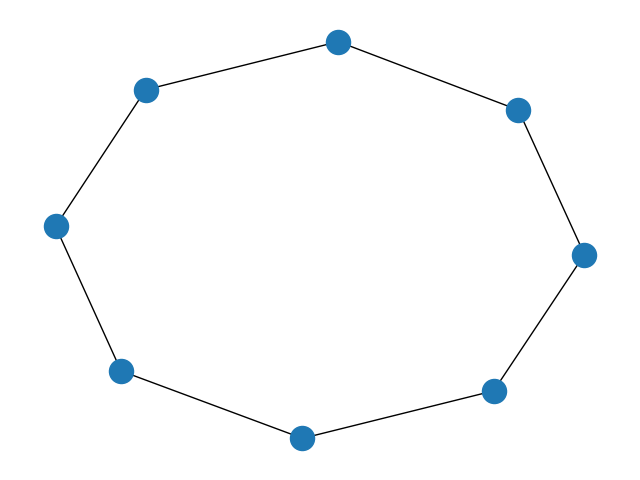
Visualizing the mapper graph
import networkx as nx

graph = zm.to_networkx(result.nerve)
nx.draw(graph)
Total running time of the script: (0 minutes 0.154 seconds)